Documentation / Screens
Screens
Screens are organized in a sidebar — Monitor (Overview, Sessions), Analyze (Breakdown, Compare, Session detail), and Data (Upload dump). Global filters apply to all aggregate views (Overview, Sessions, Breakdown).
Two ideas run through every screen. Observations are 65 deterministic rules that look at a call and say what was wrong with it, in words, with the numbers behind each finding. The experience score condenses a whole call into one number from 0 to 100, and always shows what it deducted and why.
Global filters
- Period (top bar): last 7 / 14 / 30 / 90 days or all time.
- Browser / Network type / QoE grade: multi-select from the values present in your data.
- Connection path: Any / Direct-STUN / TURN relay. Direct means the peers reached each other (host or server reflexive candidates); TURN relay means media took an extra hop through a TURN server — expect higher RTT on those calls.
Filters apply to Overview, Sessions, and Breakdown. Compare, Session detail, and Upload are per-session views.
Overview
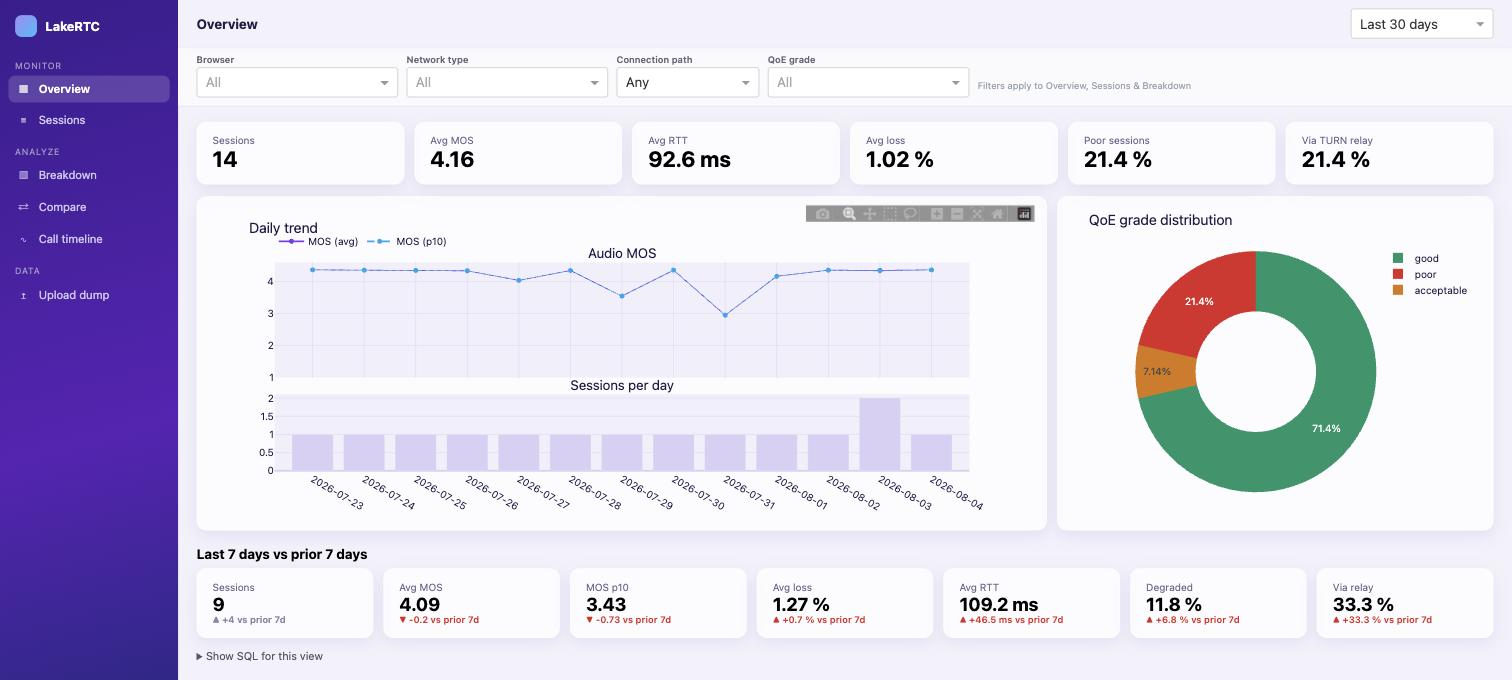
Summary cards for all your calls, daily MOS trend (average and 10th percentile), sessions per day, QoE grade distribution, and the observation leaderboard.
The Last 7 days vs prior 7 days strip is an automatic regression check: deteriorations show red, improvements green. It uses a fixed 7-day window independent of the Period filter (dimension filters still apply).
Top observations across these sessions ranks every finding by how many calls it touched. It answers the question a per-call viewer cannot: of everything that is wrong, which one is worth fixing first.
Sessions
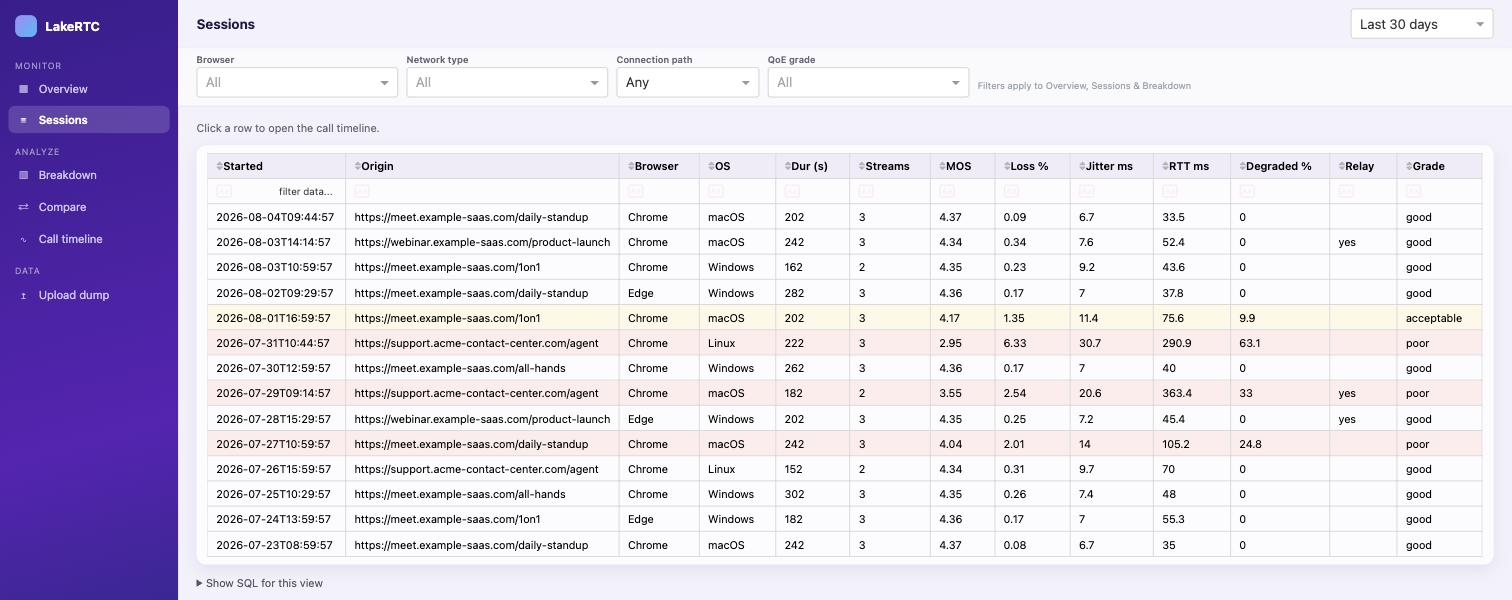
Every analyzed call with its experience score, how many findings it raised and how severe the worst one was, alongside MOS, loss, jitter, RTT, degradation ratio, TURN usage, and grade.
Sort by any column, filter inline (e.g. type >100 in the
RTT column), and click a row to open its session detail. Sorting by
score puts the calls your users actually suffered through at the top.
Breakdown
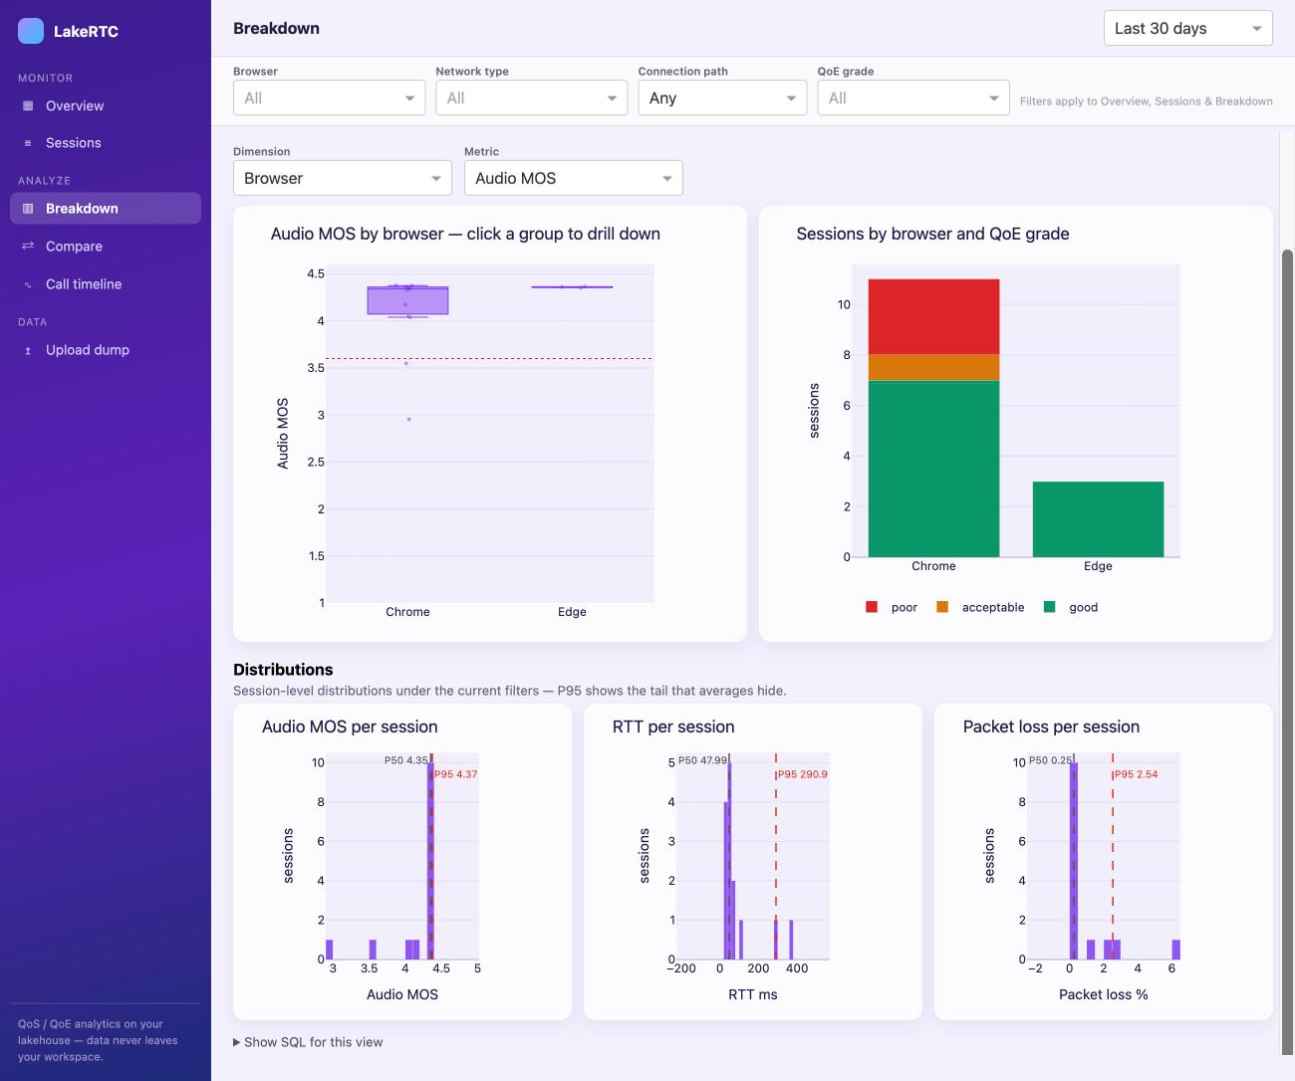
Box plots per dimension (five-number summaries computed in the warehouse), grade counts, and P50/P95 distribution histograms.
- Dimension: Browser / OS / Network type / Connection path / Day of week / Hour of day — calendar dimensions follow the display timezone selected in the top bar (it defaults to your browser’s; storage stays UTC).
- Metric: Experience score / Audio MOS / Packet loss / RTT / Jitter / Degraded time.
- Click a group (box or bar) to drill down to the matching sessions; click a session to open its detail.
- The histograms show the P50/P95 tail that averages hide.
Compare
Two sessions side by side: metric deltas in a table, full timelines below. Pick a poor call and a good one from the same site — the degraded intervals light up on one side and not the other, and that difference is usually your answer.
Session detail
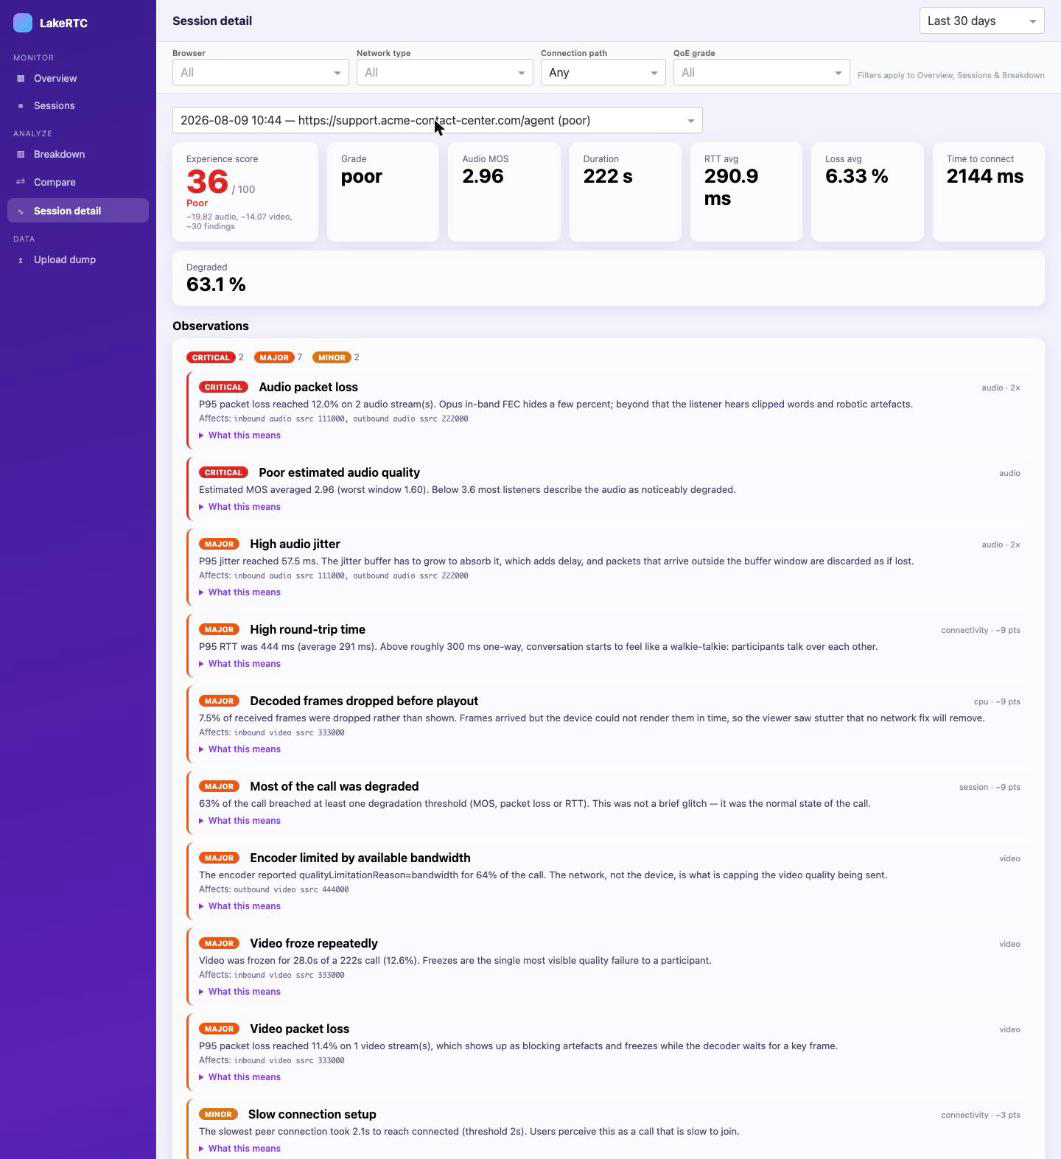
The score, what it deducted, and every finding ranked worst first.
Above the cards, Delete this session removes the call from every table after a confirmation that shows what is about to go — see Upload dump below.
Experience score
MOS answers how the audio sounded. It says nothing about video freezing, a call that took eight seconds to connect, or a microphone the browser never got permission to open. The experience score covers all of it in one number from 0 to 100:
score = 100 − audio − video − findings
The three terms cover disjoint ground, so nothing is charged twice, and all three are shown on the card. A score is never a verdict you have to take on trust — the call above lost 19.8 points to audio, 14.1 to video and 30 to its findings, and you can see which findings those were directly underneath.
Observations
65 rules across connectivity, audio, video, CPU, configuration, devices and the session itself. Each finding carries a severity, the measured values that triggered it, and which streams it applies to.
They are shown in two columns, in the order a support lead reads a call: What the user experienced — audio and video findings, under a one-line summary built from MOS, freeze time and degraded time — and Why — connectivity, CPU, device and configuration findings, under one line per cause group, heaviest first. For a call over a bad path that line reads "Network latency and loss — RTT 834 ms avg / 1023 ms P95, 21.2% packet loss", which is the sentence you want when someone asks what went wrong. The heaviest cause is also a column on the Sessions list.
Opening "What this means" gives you the knowledge-base article for that finding: what it means for the person on the call, the usual causes, what to check next, and which raw metrics carry the signal. It is written for whoever picks up the ticket, not only for WebRTC specialists.
When nothing matches, the panel says so explicitly — a healthy call reads as healthy rather than as an empty screen.
Timeline
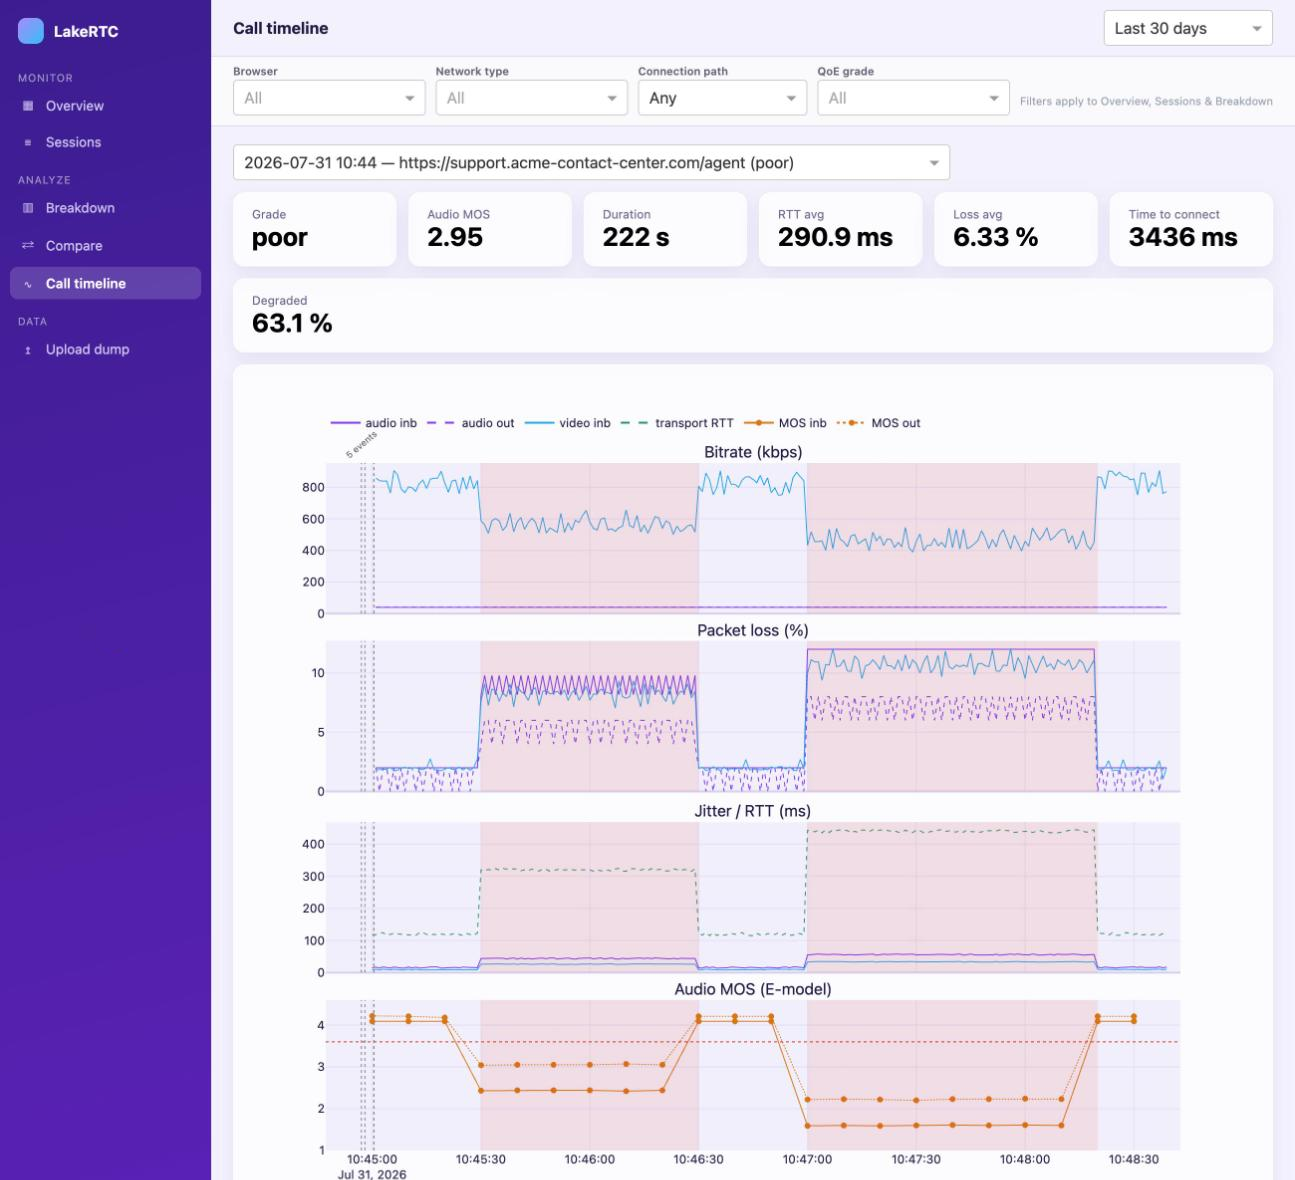
Bitrate, packet loss, jitter/RTT, and E-model MOS at one-second resolution.
- Line style encodes direction: solid = inbound, dashed = outbound; color encodes kind (violet = audio, sky = video).
- Green dashed line = transport RTT from the selected candidate pair.
- Red shading = degraded 10-second windows; the dotted red line on the MOS panel is the 3.6 degradation threshold.
- Vertical dotted lines = ICE/connection events; bursts of setup events are clustered into a single label ("5 events") — hover it for the full list.
Streams
Every stream with its codec, resolution, frame rate and freezes, plus a
video quality table that answers the question you actually have:
Limited by is the browser's own verdict on what capped quality —
bandwidth means the network, cpu means the device.
Encode and decode milliseconds per frame show how hard the machine had to
work. Adding bandwidth does nothing for a CPU-limited user, and this is
where you find out which one you have.
Connections
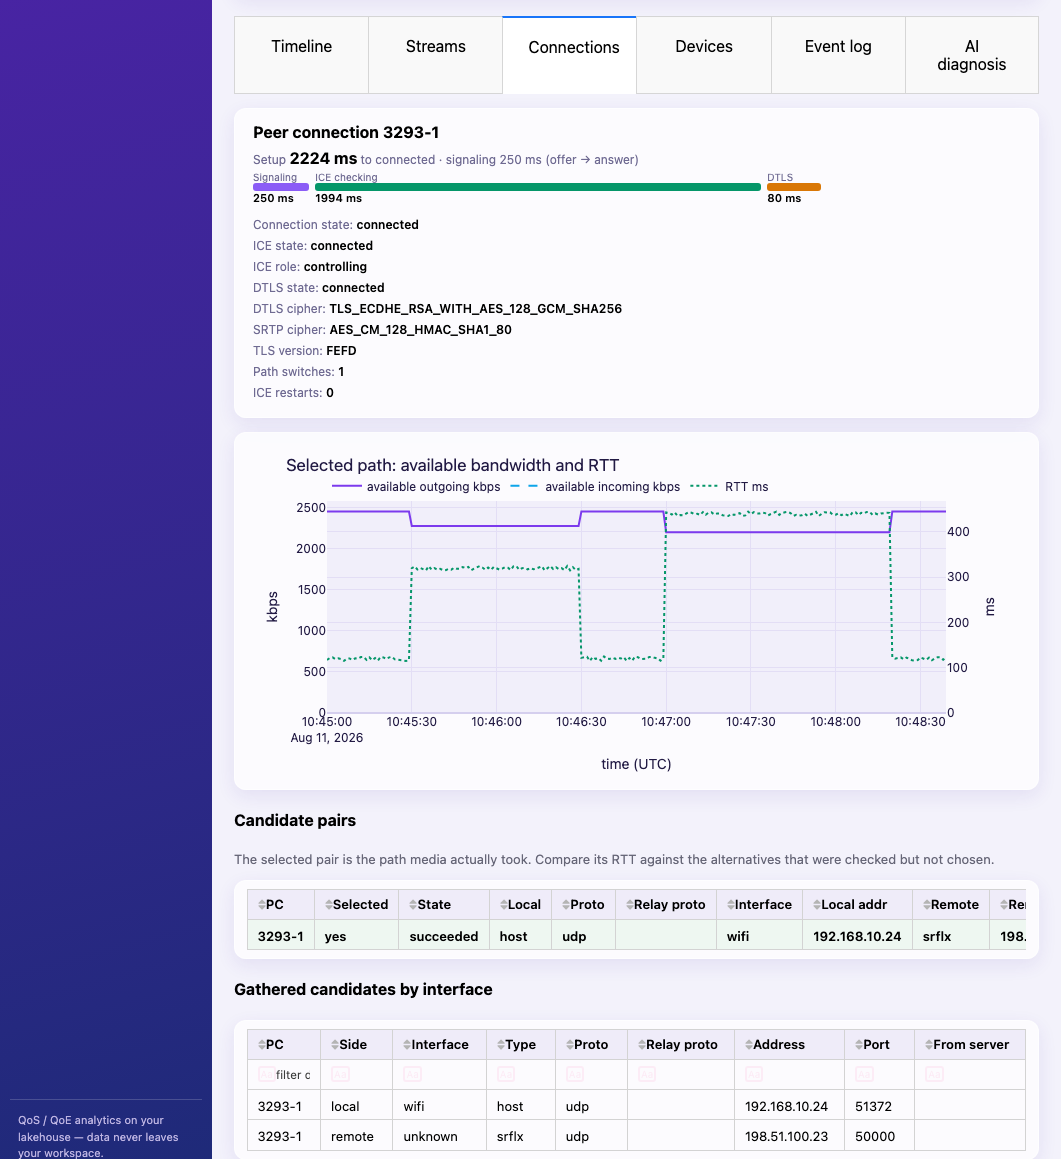
How the call was encrypted, which path it took, and what the alternatives looked like.
DTLS state and cipher, SRTP cipher, ICE role and path switches per peer connection; available bandwidth and RTT for the selected path; every candidate pair that was checked, with the selected one highlighted; and all gathered candidates grouped by network interface, so you can see whether the call went out over WiFi, Ethernet or a VPN.
Devices
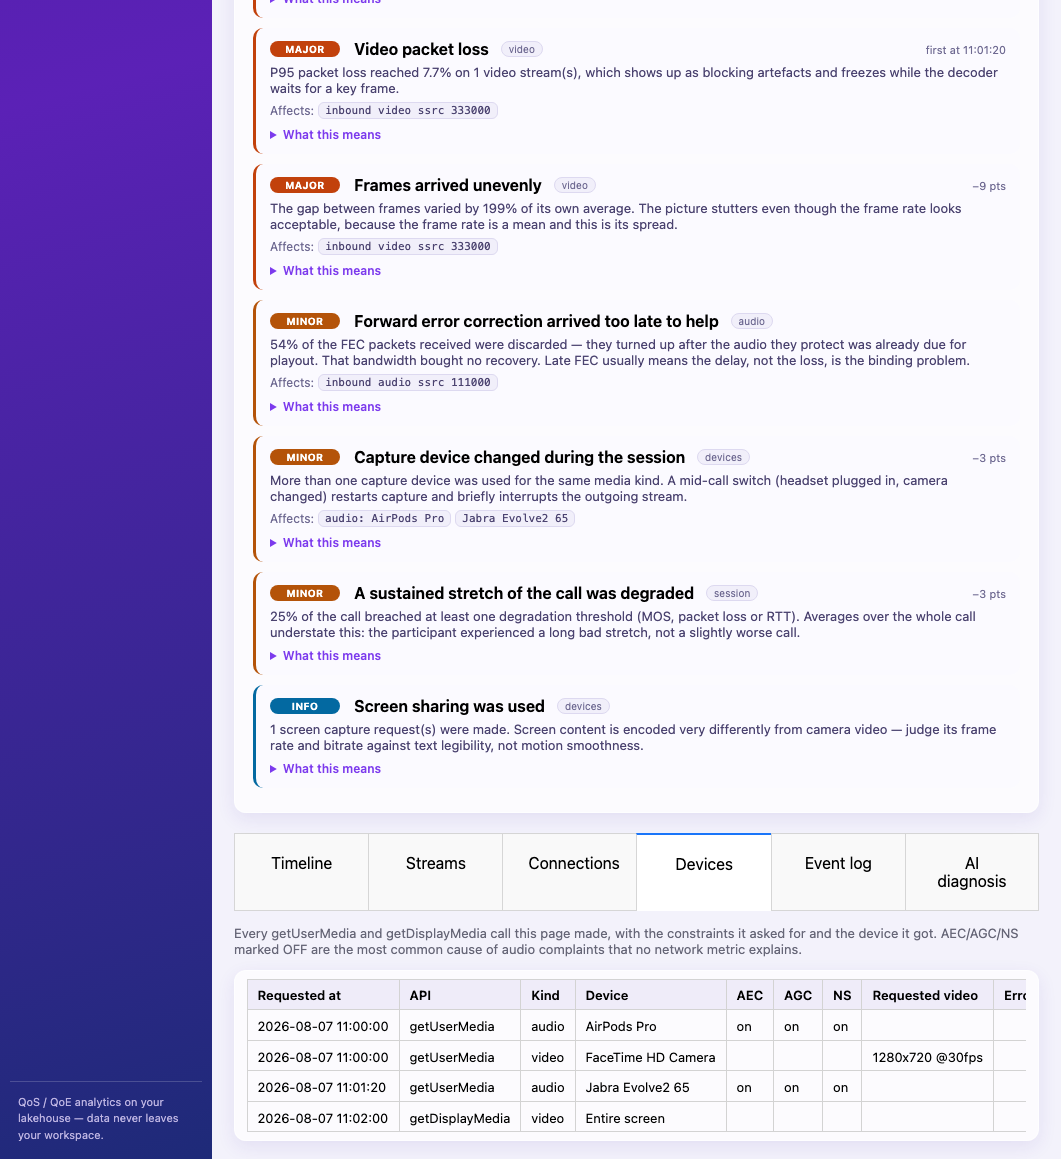
Every capture request the page made, what it asked for, and what it got.
Echo cancellation, automatic gain control and noise suppression are shown per request, and an OFF is highlighted. A call with echo cancellation disabled produces flawless network metrics and a furious user; without this screen there is nothing in the data to explain the complaint. Permission denials and device errors land here too, with the browser's own error name.
Event log
The complete update log for every peer connection — SDP negotiation, ICE
candidates, track changes and state transitions in the order they happened.
Failures are tinted red, connected green. Filter the Event
column to follow one thread.
AI diagnosis
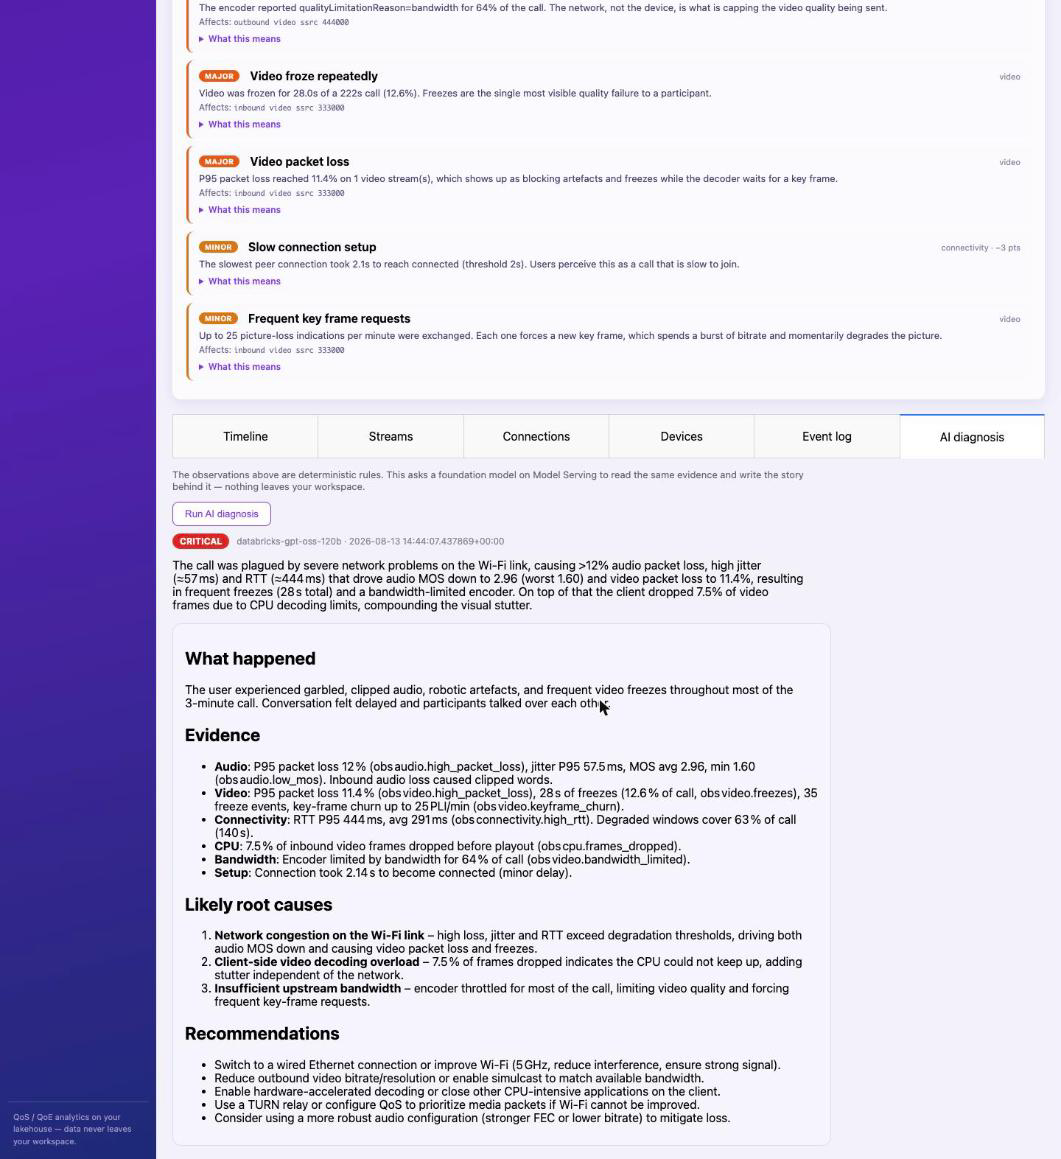
A foundation model in your own workspace, reasoning from the findings rather than re-deriving them.
The observations are deterministic rules; this asks a model to connect
them into a causal story, decide which finding is the root cause and which
are downstream effects, and say what to do. The findings are handed to it as
established fact — you can see it citing them by name in the report above
(obs audio.high_packet_loss, obs cpu.frames_dropped).
Detection stays deterministic; only the narrative is generated.
Each diagnosis has a severity badge (none / minor / major / critical), a
plain-language summary, evidence with concrete numbers, likely root causes
and recommended actions, and is stored as history in
gold_session_diagnosis next to your data. Model Serving runs
inside your workspace, so nothing leaves it.
Upload dump
Drop a dump exported from chrome://webrtc-internals — the
RTCStats dump (rtcstats_dump.gz, as downloaded) or the classic
WebRTC-internals dump — and the call runs through bronze → silver → gold and
opens in Session detail. A file you have already uploaded is recognized by
its SHA-256 and not ingested twice.
A dump is a snapshot of the whole browser, not of one app: every
RTCPeerConnection open in any tab is in it, so a file taken
next to a Meet call lands with that call included. LakeRTC splits the file
into one session per page origin (scheme://host), so each app's
numbers stay its own; connections without a page URL, such as extensions,
become a session of their own. When a file holds calls from more than one
page, the app parses it first and asks which pages to ingest — each with its
connection count, sample count and length — so the Meet call in the next tab
can be left out before anything is written. The upload result lists what the
file became.
Upload history and deletion
Below the drop zone, Upload history lists every file the app has received with its size, source, parse status and session. Each row offers what can safely be removed:
- Delete session and upload record on a parsed dump removes the call from every silver and gold table together with its ledger row, so the same file can be uploaded again afterwards. The same action is available as Delete this session at the top of Session detail. When a file became several sessions the button reads Delete session and the ledger row stays until the last of them goes.
- Delete upload record on a failed upload removes just the ledger row.
- Sessions that arrived through the collection SDK are read-only here: the ingestion job would bring them straight back from your raw files.
Every delete goes through a confirmation that shows the file, start time and row counts first. Deletion is logical — Delta time travel keeps the old files until your retention period expires — and each one is written to the app log with the user who ran it.
Danger zone (admins)
Users listed in the app's APP_ADMINS setting additionally see
a red Clear all LakeRTC table data control at the bottom of the page.
It truncates every table once you type the exact catalog.schema,
and reports any rows that a concurrent upload wrote in the meantime. Use it to
reset a trial or swap demo data; stop uploads and the SDK ingestion job first.
Show SQL
Every view has a "Show SQL for this view" panel with the exact, fully qualified query the app ran — paste it into the Databricks SQL editor, a notebook, or an AI/BI dashboard to go beyond the app.
Terms used on these screens
| Term | Meaning |
|---|---|
| Jitter | Packet-to-packet variation in transmission time. Receivers smooth it with a jitter buffer; what the buffer can't absorb becomes audible glitches or frozen video. |
| RTT | Round-trip time — how long a packet takes to reach the peer and come back. The timeline's transport RTT comes from the selected candidate pair. |
| Packet loss | Share of RTP packets that never arrived. Real-time media can't wait for TCP-style reliable delivery — recovery is best-effort (retransmission requests and forward error correction), and what isn't recovered surfaces as concealment, freezes, or artifacts. |
| ICE | The protocol that finds a working network path between peers by testing candidate pairs (host, server reflexive, relay) with connectivity checks. |
| TURN relay | A fallback server that forwards media when no direct path exists — it adds a network hop, and a consistently high TURN share is worth investigating. |
| Degraded window | A 10-second window where MOS < 3.6, packet loss > 5%, or RTT > 400 ms. |
| Observation | A finding raised by one of 65 deterministic rules — a named condition with a severity, the values that triggered it, and a knowledge-base article behind it. |
| Experience score | The whole call as one number, 0–100: 100 minus what audio quality, video quality and the findings each cost it. Unlike MOS it accounts for video, connection setup and device problems. |
| Quality limitation reason | The browser's own statement of
what capped video quality: bandwidth (the network) or
cpu (the device). It removes the guesswork from the most
common diagnostic question. |